Payout Curve
A payout curve refers to the relationship between performance or achievement levels and the corresponding payout or reward offered to individuals or groups. It is a graphical representation or mathematical formula that determines how incentives are distributed based on specific performance targets or metrics.
The basic
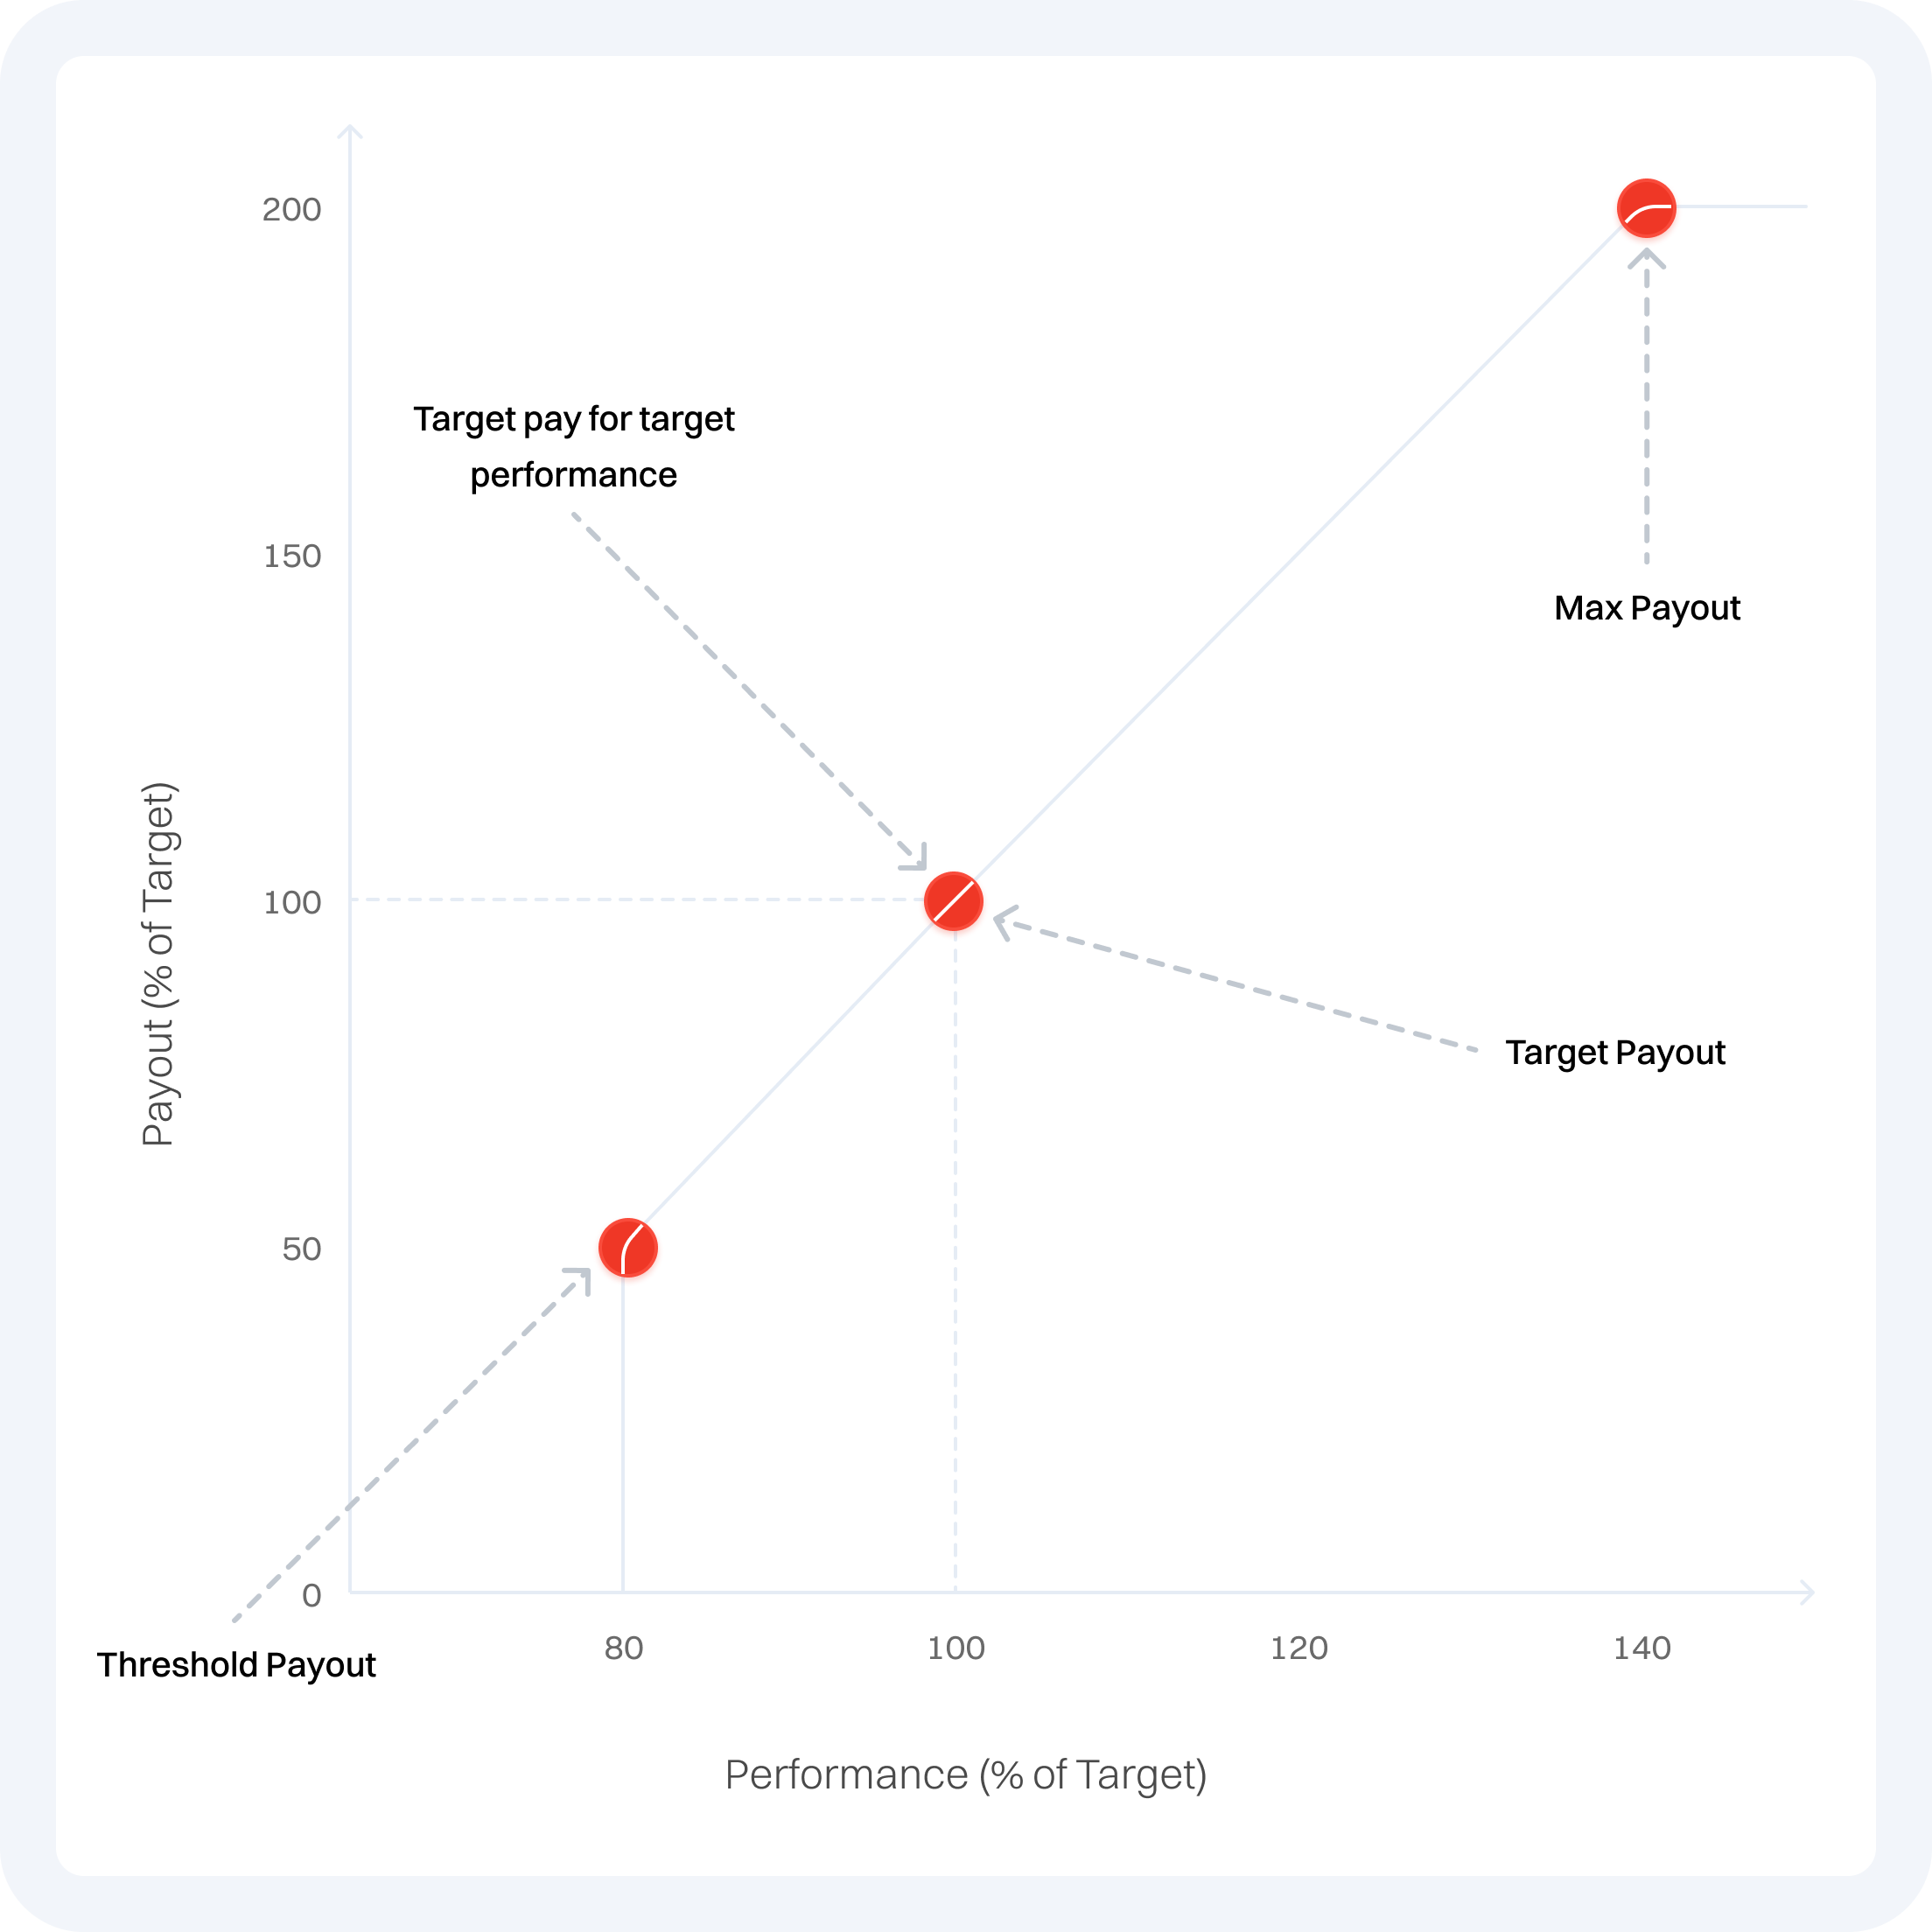
The payout curve is a graphical representation that shows the distribution of payouts for different levels of performance in a pay-for-performance system. It illustrates how much money or reward an employee will receive based on their performance level.
- There are typically three components to an incentive payout curve: a threshold level, a target level, and an excellence level. In addition, there are additional concepts such as deceleration and caps can be applied.
- The threshold level is the minimum level of performance required to receive any incentive payout.
- The target level is the level of performance at which the maximum incentive payout is earned.
- The excellence level is the peak level of performance that can be achieved beyond the sales target at which the maximum acceleration kicks in.
- Incentive payout curves should be transparent, easily understandable, and aligned with the organization's overall strategy and goals.
Threshold
The threshold in a payout curve is a specific point or level that must be reached before any earnings are attained. In other words, it is a minimum amount or level of performance that must be achieved in order for a payout or reward to be granted.
- At the lower end of a company's peer-performance range (10th percentile).
- Above the previous year's results if the markets are growing.
- High enough to create some modest value for the company.
- At a point on the curve where sales personnel have a 90 percent chance of achieving the minimum payout.
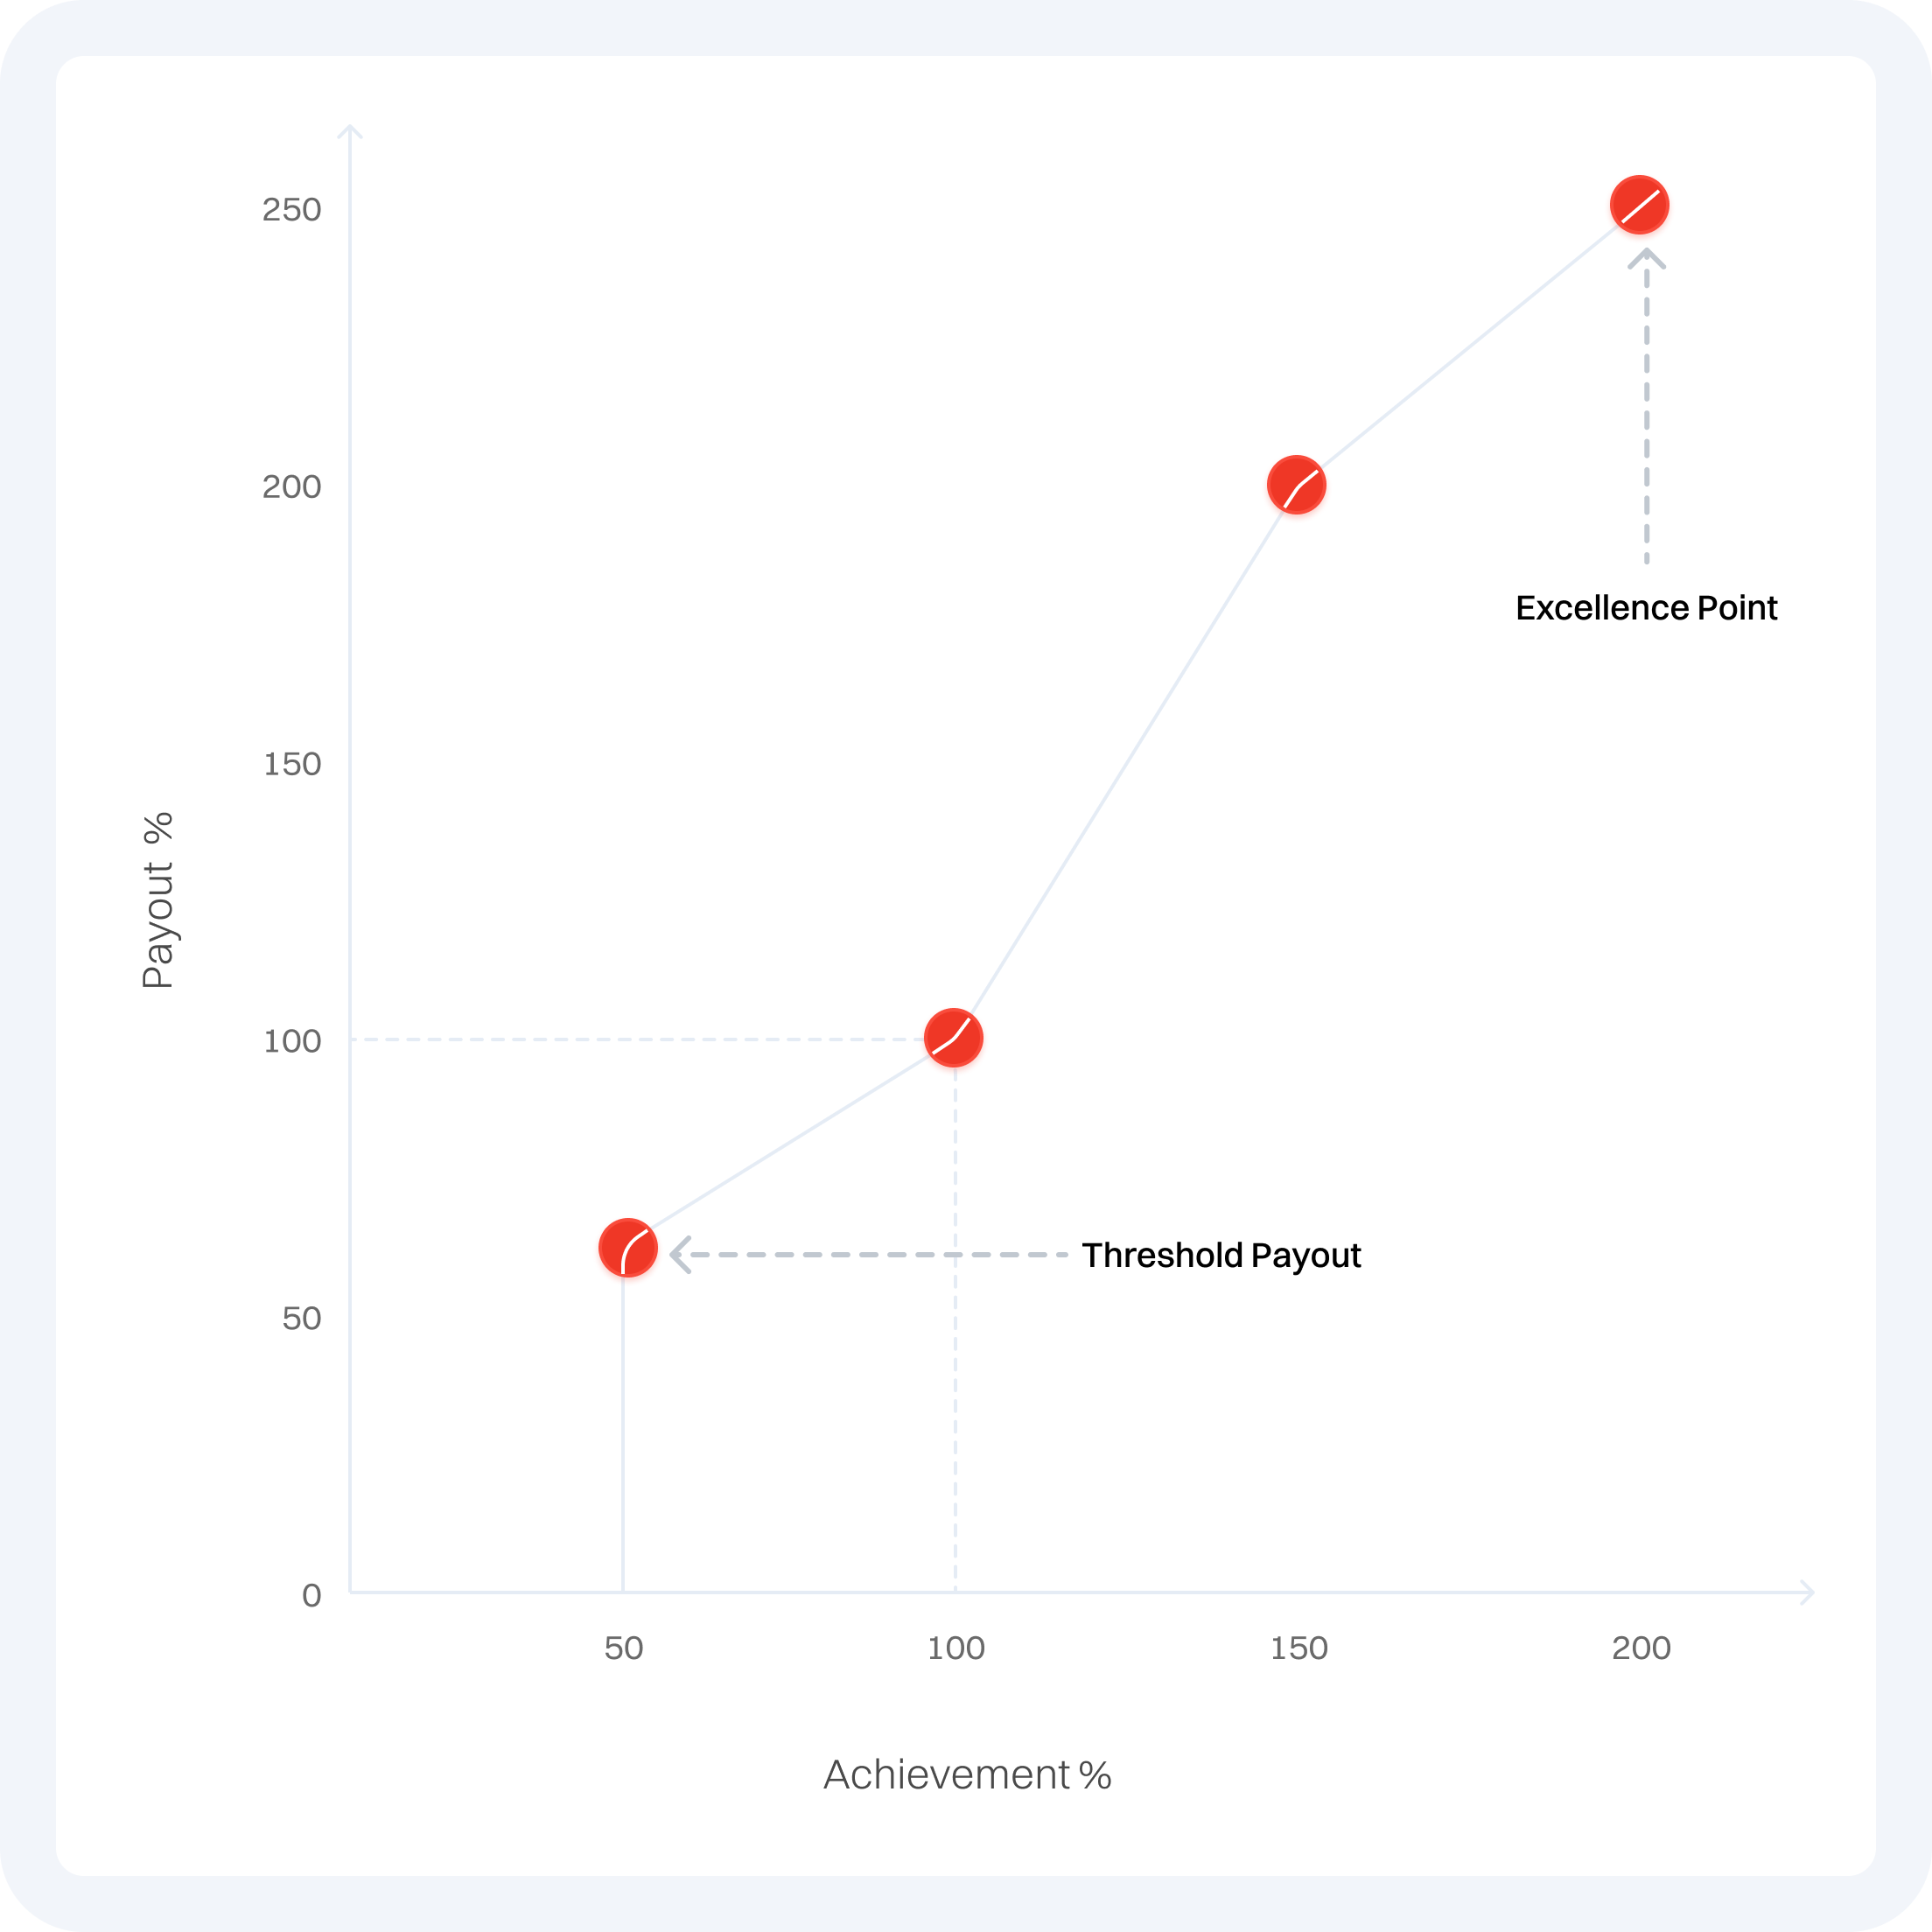
Excellence
Excellence refers to the peak performance point beyond quota for the salesforce. About 10% of the salespeople are expected to achieve excellence performance. This is also the point which corresponds to a higher incentive payout than at target.
- At the top end of peer performance (90th percentile).
- In line with previous performance and record-level company performance as is appropriate.
- At a level that will create significant value for the company as compared to peer and historical performance.
- At a point where sales personnel have about a 10 percent chance of hitting the maximum.
.png)
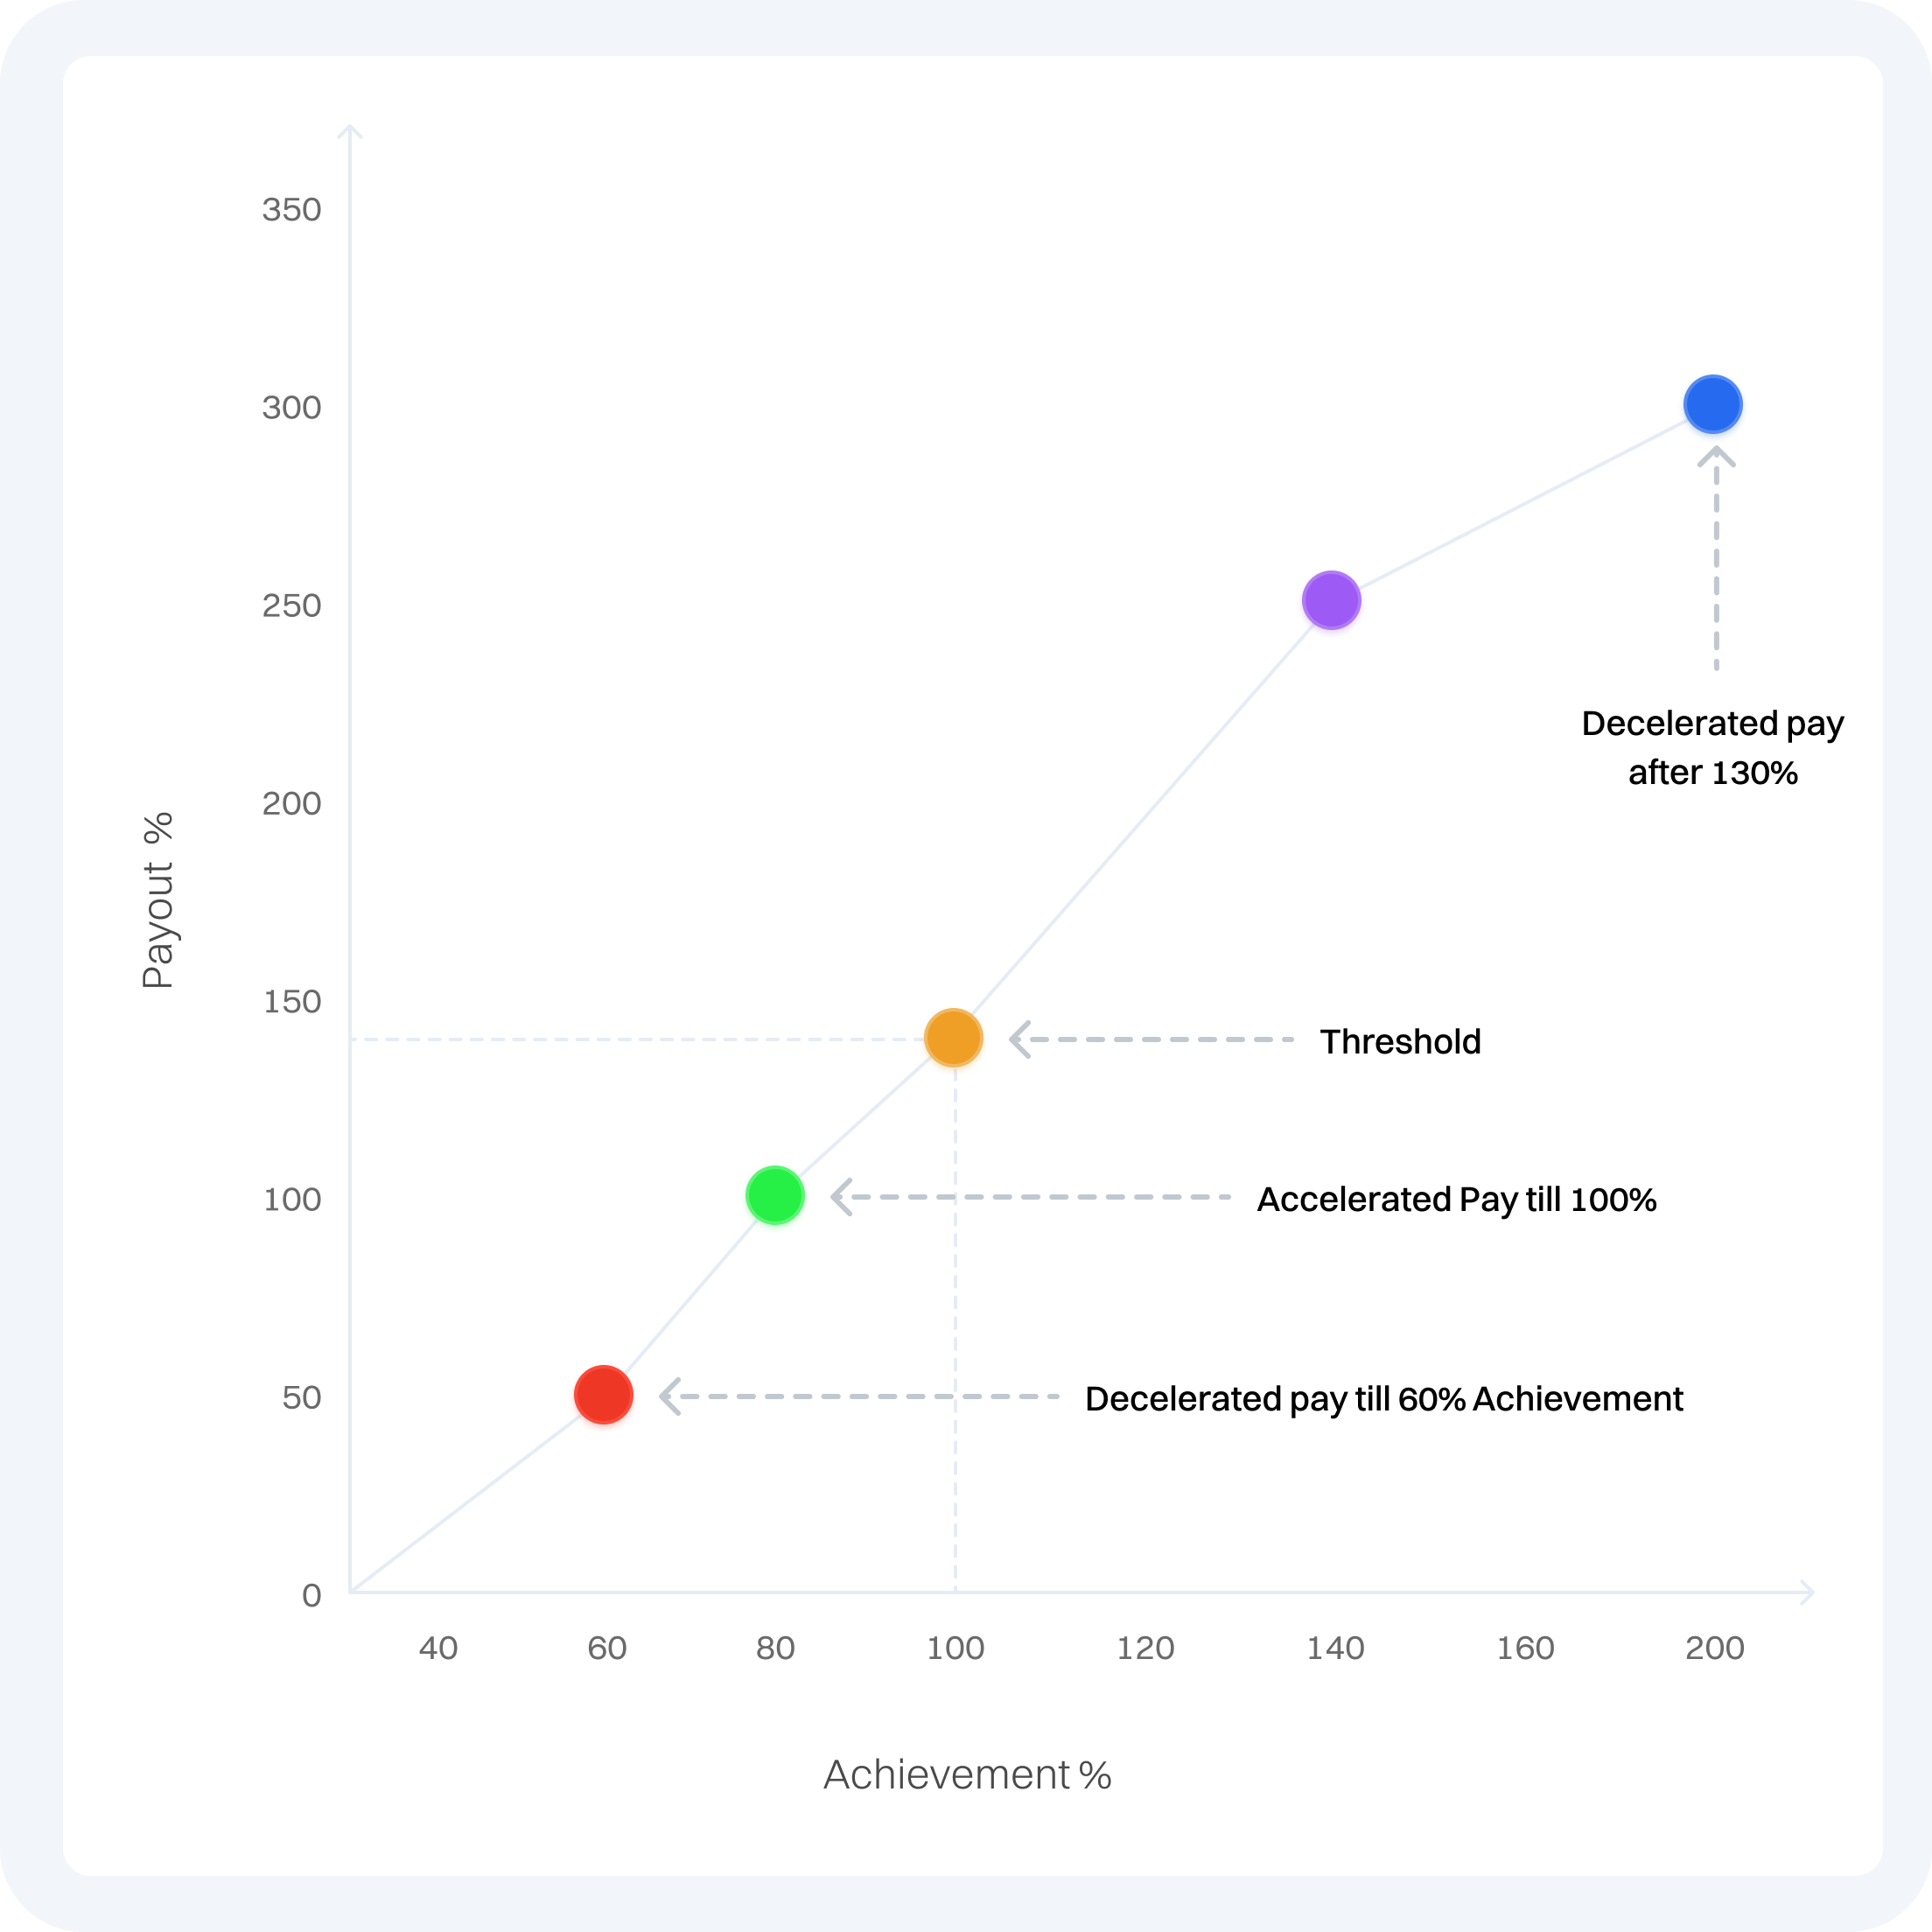
Acceleration/Deceleration
Deceleration is the reduced rate (linear slope > 1) at which the payouts can be achieved.
Acceleration refers to the higher rate of payout per point increase in performance (linear slope > 1).
- Penalizes low performers who do not achieve a certain sales level by further lowering their payouts.
- Encourages sales personnel to achieve a viable sale below quota that helps both the sales personnel and the company.
- Can be used to achieve overall portfolio focus by pushing sales personnel to sell other products in their portfolio.
- Can be used in place of payout caps where the earnings for a salesperson cease to increase significantly.
- Helps the company plan for inventory without making sales personnel feel that their earnings are being capped.
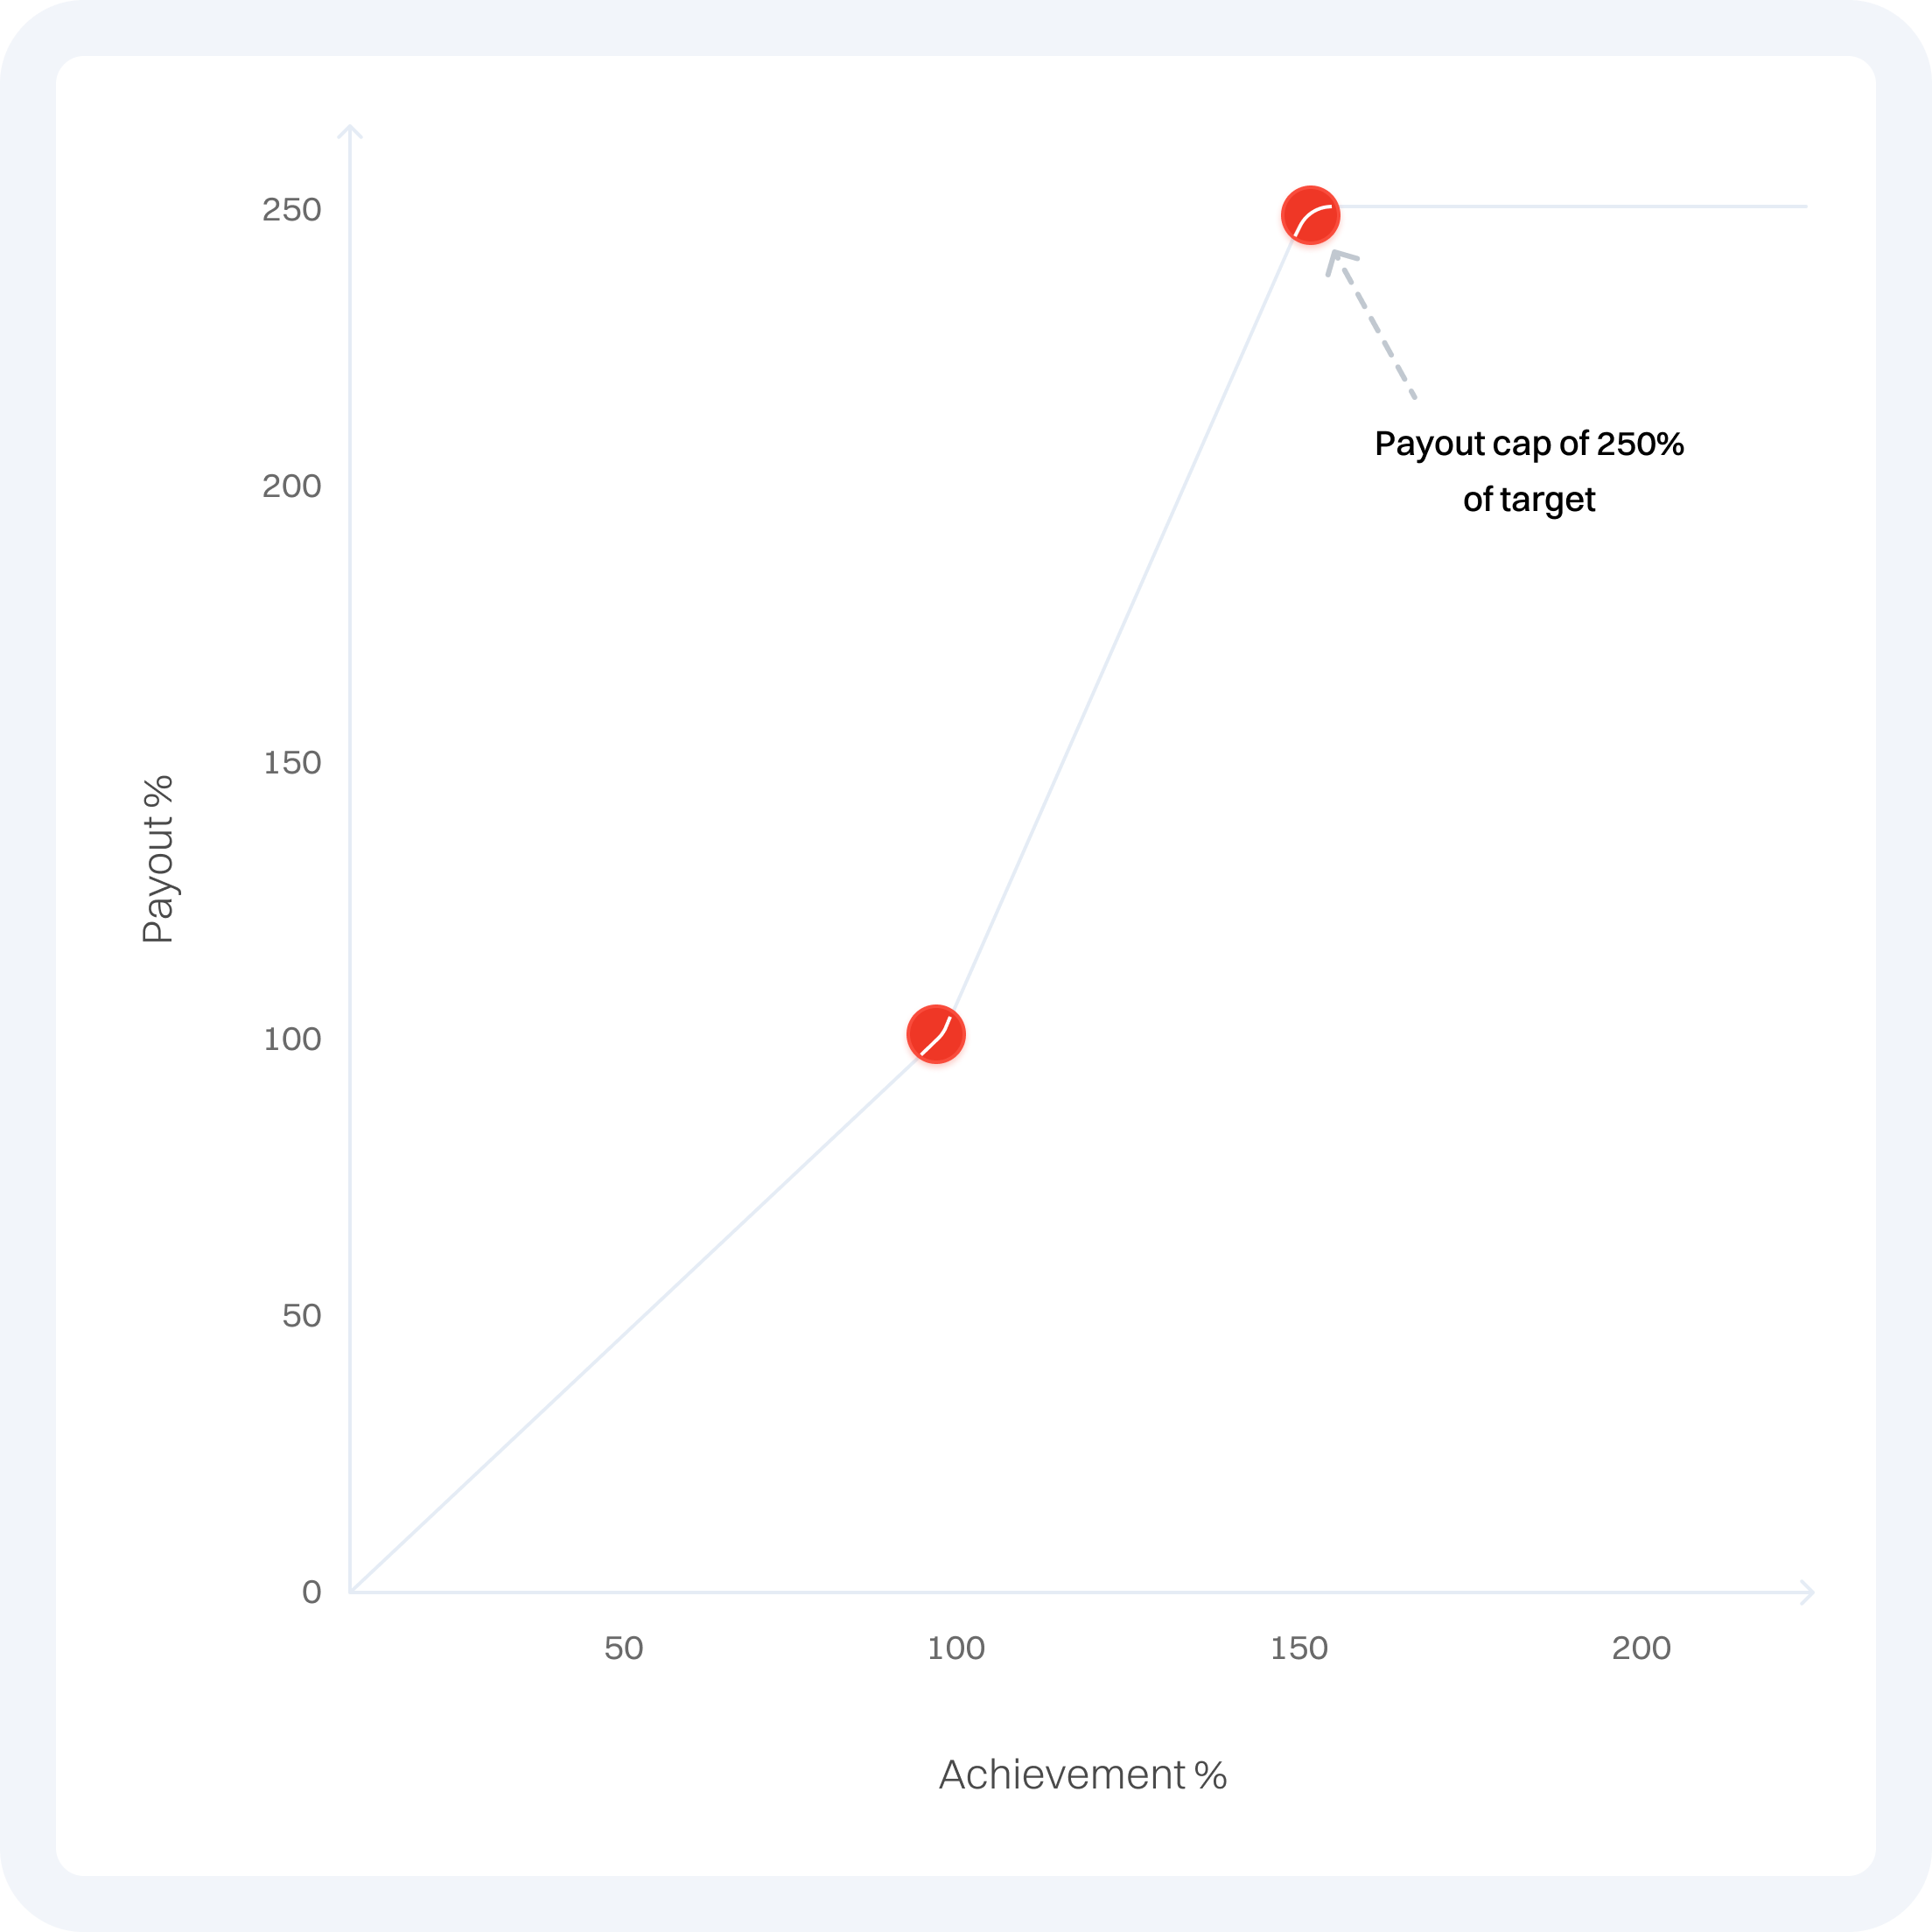
Caps
Cap refers to the highest payout that can be achieved in the plan for a product. Once a salesperson achieves a performance equal to the cap, no more incentives will be earned for any further increase in sales.
- The decision to cap an incentive plan depends on the firm's ability to predict market demand and financial goals, culture and philosophy.
- Caps can dampen the motivation of top performers and delay incremental sales.
- Soft caps can be used where payout exceeding high performance is placed on hold and payable only if the salesperson makes their goal at the end of the plan period.
- In unstable markets, incentive caps prevent unearned windfall sales if goals are easily attainable.
- Caps can promote controlled selling and ensure higher customer service for complex products with long implementation cycles.
Types of incentive payout curve
There are several types of incentive payout curves that companies can use to design their incentive programs. These curves define how the payout or reward is determined based on performance levels.
Here are a few common types of incentive payout curves:
- Linear payout curves pay salespeople on a linear curve, with a constant, progressive, regressive, or mixed relationship with payouts.
- Progressive payout curves introduce a higher rate of payouts above target to reward top performers and motivate them to achieve greater sales.
- Regressive payout curves reduce the rate of payouts once a benchmark is achieved and are used when sales are under forecast or there are serious production/logistic limitations.
- Mixed linear curves combine progressive and regressive curves to motivate salespeople to achieve more than their quota while providing protections of cost.
- Step curves are used in tiered plans where each tier has a different commission rate or bonus amount and are beneficial in scenarios where the market is unstable.
- Matrix payout uses multiple metrics to determine the payout for a product and can be additive or synergistic.
Build payout curves that drive behavior.
See how Aurochs models, calculates, and pays your incentives — accurately, and in weeks.